5-stage Learning Analytics Maturity Model for Optimizing L&D ROI
Are you measuring the impact of your learning?
Hi, Friends,
I've been running out of ideas lately. So, I decided to update my thinking on Learning Analytics with some examples and share it with the world once again, as this subject is extremely important.
I am all ears if you have suggestions on what I can write about!
In today's issue, we will talk about Learning! Yay!
The learning and development budget can be over $5,000 per employee for mid-to-large-sized organizations. That’s a significant investment. But how do you measure the return on that investment in business outcomes? And how do you leverage that ROI insight to guide strategic decisions about your learning and development programs?
The answer is learning analytics. But... harnessing learning analytics is a challenge many L&D leaders struggle with—one I’ve previously tackled.
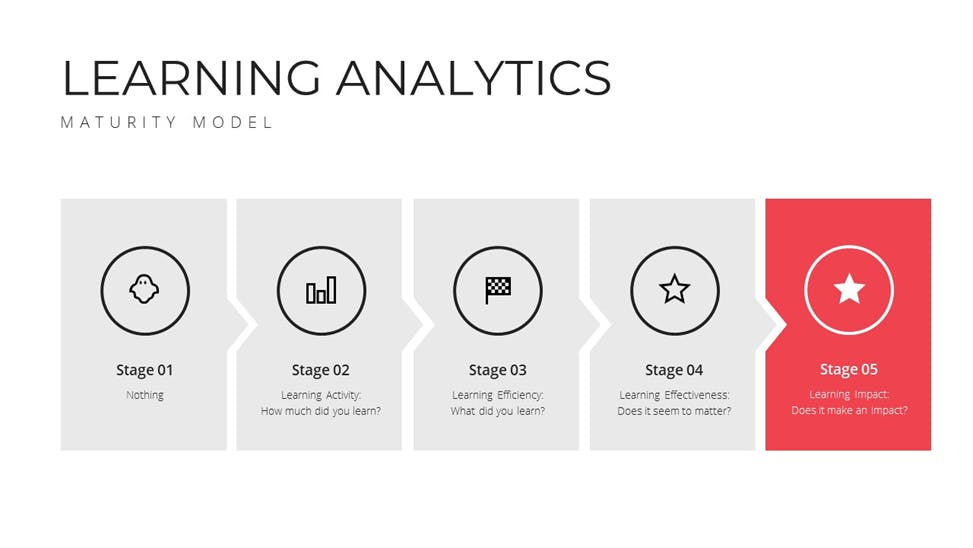
I’ve developed a five-stage Learning Analytics Maturity Model to help L&D pros assess where you are today and how you might advance to reach the next level.
I’ll walk you through the model, offering insight into my experiences as we move through the 5 maturity stages:
Nothing
Measuring Learning Activity
Measuring Learning Content
Measuring Learning Effectiveness
Measuring Learning Impact
Let’s dive in!
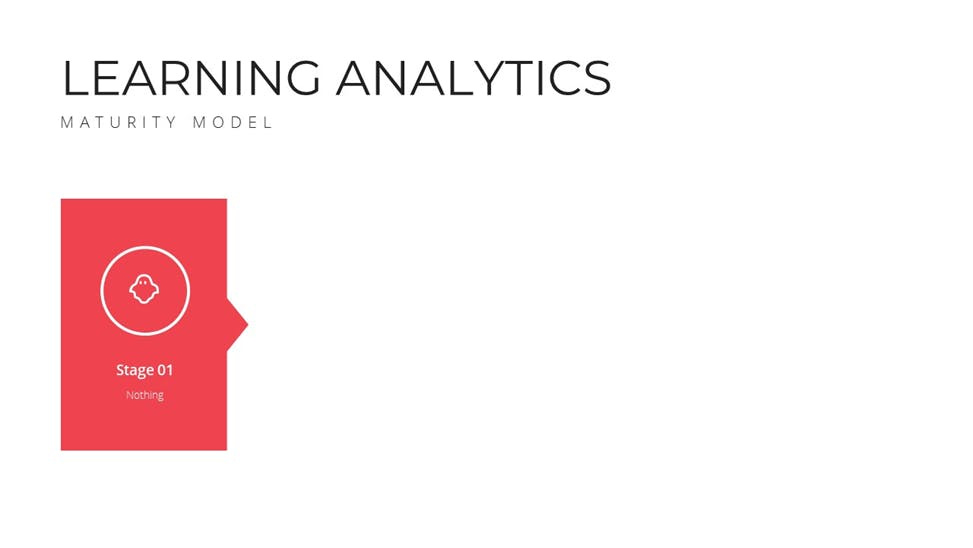
Stage 1: Nothing
What it looks like: In this stage, no formal learning and development programming is happening at the company. Many start-ups operate in this state, and L&D is not their priority.
As start-ups transition to scale-ups, they focus on driving revenue, refining their product, and building customer awareness. That’s not to say that learning isn’t happening! It is—in the form of people experimenting with different approaches to the problems and ideas, gaining new skills, and acquiring experience on the job—but L&D as a program is usually ad hoc here, not robust and consistent.
As the outward efforts become more successful, employees ask, “What about the employees? How can we grow and develop here?”
What’s next: Without formal L&D, there are no learning analytics to capture and no ROI to quantify. It’s time to consider implementing a formal learning and development program that can be measured.
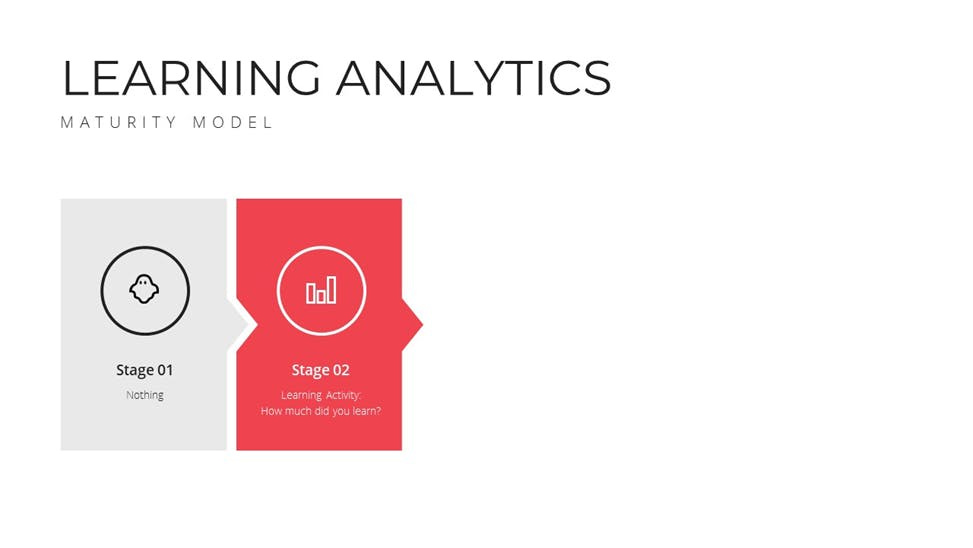
Stage 2: Learning activity: How much did you learn?
What it looks like: Once your company reaches this stage, you will know whether people utilize your learning offering and to what extent, including what they are interested in learning and how they engage with content.
When the company reaches stage 2, it introduces eLearning modules with built-in metrics; it finally has some data to work with. For example, companies can see how many licenses are active, how many are used to log in, and how many people participate in learning. The next set of metrics shows how many videos the learners watched, which assessments they completed, and the average scores.
Some companies introduce live programs here, like a leadership program. You can then see that some cohorts have 100% attendance while others trail off to 0% after several sessions. This information is valuable because it tells us which cohorts find the content helpful and which cohorts need different activities—use this information to retool your program.
While you may not run advanced analytics in stage 2, the data you capture is still critical. It can provide directional evidence and raise awareness of what’s happening in your organization.
Which tools to use: Simple summary statistics, dashboards, and graphs do the trick.
What’s next: Although companies gain valuable insight at this stage, they’re unable to gauge whether employees can do something successfully and efficiently—time to get more sophisticated.
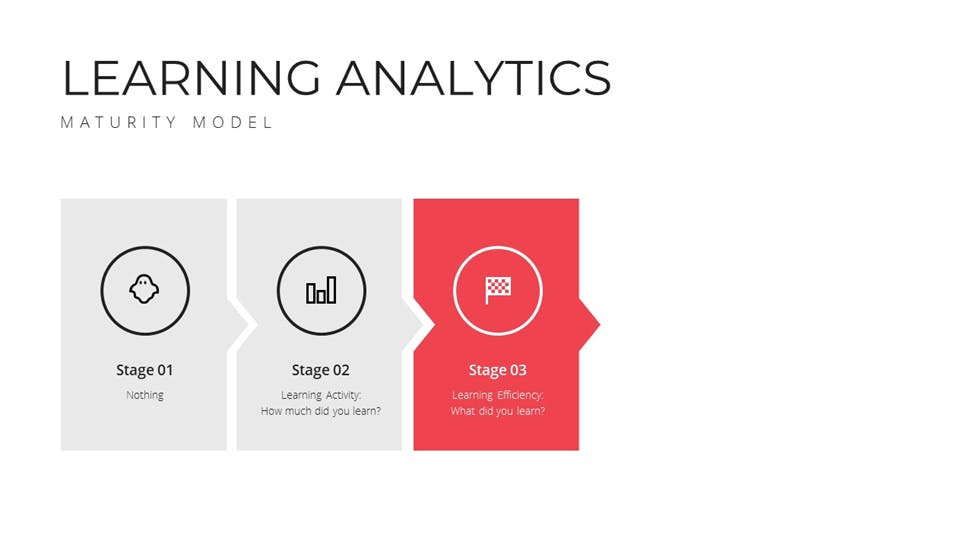
Stage 3: Learning efficiency: What did you learn?
What it looks like: This stage typically measures competencies within the organization. Companies know what employees should learn and can track the progression.
Here, companies invested more in L&D.
They now build a competency model and library aligned with a career model that tells employees precisely the skills they will learn in training and how these will impact their development. You start tracking learning focused on Excel skills, influence, and product management.
In this stage, you are getting more precise with learning and can align it with strategy. You can also start integrating learning into the career development model, helping people understand the expectations. However, this still needs to tell you if competency predicts outcomes and ROI.
Which tools to use: You still use simple summary stats and graphs here, but segmentation across groups and competencies becomes abundantly clear.
What’s next: In stage 3, we assume that if someone is at a high level of competency, they will be more successful in their role and more likely to produce positive business outcomes. But we don’t test that assumption. That comes in stage 4.
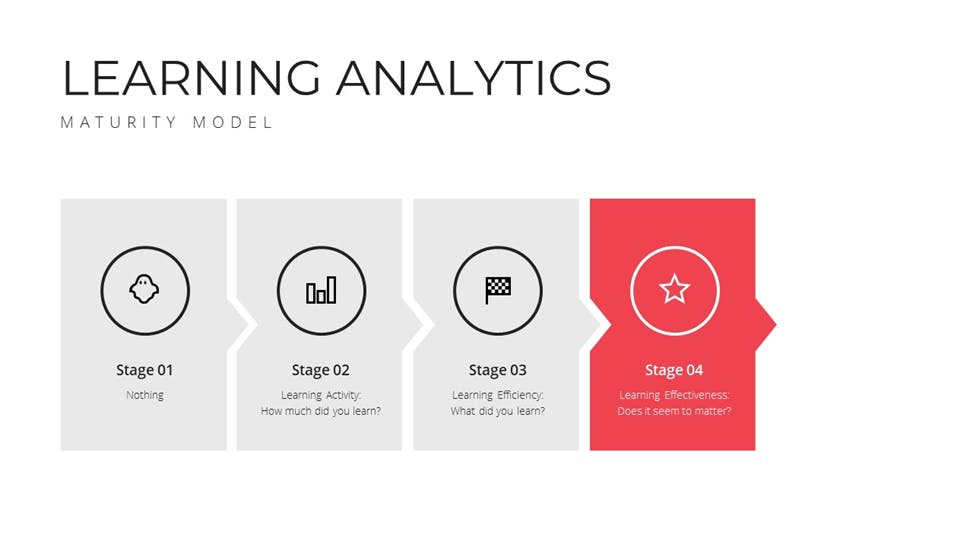
Stage 4: Learning effectiveness: Does it seem to matter?
What it looks like: Stage 4 is where things get interesting: Companies can test their assumptions and measure if their learning and development programs are moving the dial on their business goals.
Let’s say your company has a menu of ten competencies for salespeople. And you can see that being proficient in all ten results in a revenue increase of 20%. Using advanced learning analytics, you could test whether all ten competencies are necessary to drive the outcome—or maybe just one or two.
To connect the dots in a statistically reliable way, it’s essential to invest in an HR analytics team. But it doesn’t have to be a huge crew. It just needs to be somebody with a good understanding of how to effectively connect the competency data with the business outcomes data.
(Yes, you could pull in a data scientist from the product team or a consultant, but you’d need confidentiality restrictions or anonymous data to work with since you’ll be analyzing people’s performance.)
Sounds tedious. But it is simple if you know what you are doing.
Also, this is where your business leaders see the real impact of the L&D function.
Which tools to use: Leverage regression modelling and data science.
What’s next: In stage 4, you examine the correlational relationship between learning and outcomes. In stage 5, you seek causation.
Stage 5: Learning impact: Does it make an impact?
What it looks like: Stage 5 is the “Holy Grail.” This is where companies definitively establish a causal link between learning and ROI (performance, retention, and engagement). This stage is labour-intensive, requiring project and stakeholder management, but it is simple statistically.
This is where you create an experimental design for your learning.
To do learning analytics properly here, you must have multiple groups, including a proper control group. Most companies only experiment with one group and do a before and after analysis. But, to get to a definitive outcome, control is critical.
Test learning with one group, a different type of learning with a different group, and hold another group waiting for learning (your control). You then measure your outcome before and after.
If your learning is effective, you should see effects for groups 1 and/or 2, not 3. After all, they only waited.
Keep an open mind, no matter the outcome. The goal is to learn and build on that.
Which tools to use: Use experimental design with random assignment, before and after assessment, and an actual control group.
What’s next: Iterate with a focus on ROI.
Parting words
If there’s one takeaway from what I’ve shared, it’s this: Get moving. When it comes to learning analytics, many organizations plan too much and wait too long. Regardless of your maturity stage, you’ll learn much faster if you jump in and figure it out versus standing on the sidelines.
See you next week!
And I am serious! Have ideas? Tell me!!!
K
Whenever you’re ready, there are 2 ways I can help you:
#1
If you’re still looking to get started in People Analytics, I recommend starting with my affordable course:
Practical People Analytics: Build data-driven HR programs to 10x your professional effectiveness, business impact, and career. This comprehensive course will teach you everything from building an HR dashboard for business results to driving growth through more advanced analytics (i.e., regression). Join your peers today!
#2
If you are looking for support in your human capital programs, such as engagement, retention, and compensation & benefits, and want to take a more data-driven approach, contact me at Tskhay & Associates for consulting services. Or simply reply to this email!


