
People Analytics Starter Tech Stack
A quick view into what you might need to get started!

Hi, Friends,
I was overwhelmed by the reception of my course last week!
It has been super exciting! And I have extended the 40% off sale with code CYBER40 until the end of November! If you or someone you know is interested in learning People Analytics in a practical way, now is the time!

AND… I have some news! I am recording a prequel to my Practical People Analytics Course, People Analytics 101, which will be available for FREE! This course will be more theoretical and have everything you need to start your people analytics journey! I will send out the signup form over the next few weeks!
Finally, I am also starting a podcast, Let’s Get Real with HR, and thus far, I am still wrestling with the equipment. But I would love to have some of you as guests on the pod. Check out this logo!

Anyways!
Today, we discuss a critical piece of people analytics—the tech stack. Or, put another way, what do you need to get started in People Analytics?
I posted this picture on LinkedIn Yesterday to quickly summarize the basic tech stack you need to get started:
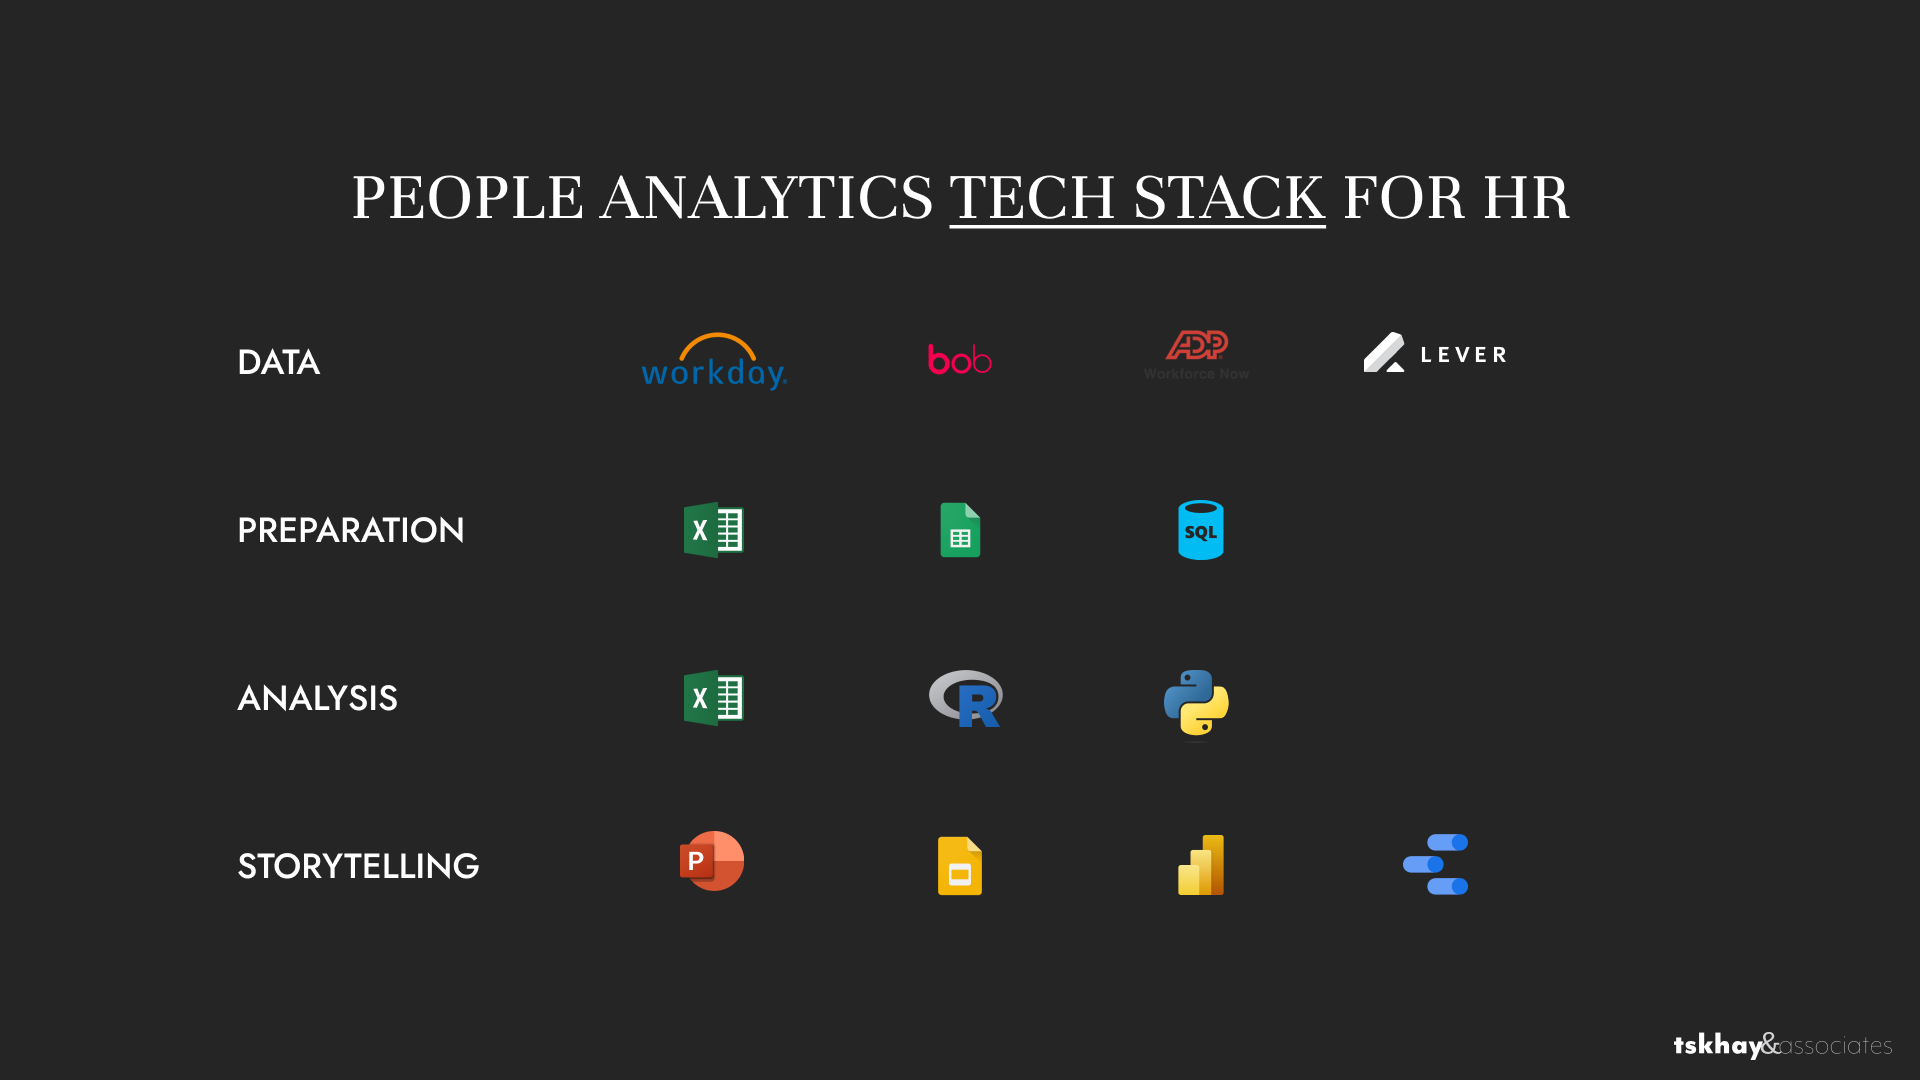
These are just the basics, and some are illustrative. Still, you will quickly notice that I don’t have any complex AI tools here or specific People Analytics software like Orgnostic or Visier. Those tools are great, but they are not available for most HR organizations. Hence, I tried to keep the list simple.
So, we shall talk about:
Data
Preparation
Analysis
Storytelling
…in today’s issue.
Let’s go.
Data
To do any analytics, you need good data.
Most organizations use an HR Information System (HRIS) like Workday, Namely, BambooHR, or HiBob as their records system and the source of truth.
They will also have something like Lever or Greenhouse to track the data about applicants for recruitment.
And even smaller organizations will have a simple spreadsheet.
The purpose of these systems is to store the data in a single place and allow it to be the single source of truth. Yes, I said it again.

Source of truth (in the context): the place you go to for accurate and up-to-date information on your people.
Think of these systems as a glorified database of everything that has and will happen in your company from the people perspective.
The truth is, the better your records are, the better the analysis will be. So, spend time setting up this system upfront.
From HRIS systems, I prefer HiBob over others for medium-sized enterprises.
Processing
Now that you have the data organized, you need a system for processing it.
For most, it will be Excel or Google Sheets. For some, it will be SQL. And others might use something like R or Python.
Use these tools to prepare the data for analysis: ensure consistency, address outliers, transform the distribution, work through data integrations, and, of course, address missing values.

My preferred system here is Excel for simple transformations and R for more complex processing requirements, like multiple imputation (when you generate missing values using statistical techniques).
Analysis
Only a few are big advocates of Excel, Python, and R for analysis.
Other people don’t know how to use these tools well.

I like these tools because they are flexible. If you understand these tools well, you look at the data as a canvas while using math as your medium and uncover the emerging truths. It’s like sculpting, where you unravel the truth beneath the stone.
I cannot think of a day I needed anything else to answer a people analytics question.
There are specialized analysis tools, of course.
However, mastering the primary analysis tools in Excel, R, and Python is 100% the way to go. In this case, you are not learning the tool; you augment the way you see the world.
My preference is for Excel and R for analysis.
However, if you pick one of the two programming languages, consider Python instead of R. It’s much more flexible.
Storytelling
Chatting with Matt Lewis-Strauch, an AVP at SunLife and my first manager in the Deloitte days, we reminisced about the deck training we received during our tenure.
It was another level; some people even called my skills the deck magic. And there are plenty of people who are much better than me.
I later brought a similar approach to Top Hat, working with our marketing team to generate templates specific to the company and consider how we could present well.
Yes, decks are the bread and butter of consultants as they bring the story to life, serve as an effective visual device, and can be set on the desk to be referred to again or forever forgotten.

So, master PowerPoint and Google Slides as your number one Storytelling device.
Next, move to dashboards like Power BI, Looker, and Tableau.
I know these are cool, and their benefits come from being interactive.
But this coolness and interactivity will not help you if you don’t know how to communicate effectively in the first place, and this is why the decks are a much more powerful device.
Use them to master storytelling. Then, bring the story to life with interactive dashboards.
As you can see, the tech stack in People Analytics can be straightforward. There are no complex tools. There are no priceless solutions you can buy. All you need is the neatly stored data, Excel, R, and a slide deck, and you can start making miracles.
Start today.
K
Whenever you’re ready, there are 2 ways I can help you:
#1 If you’re still looking to get started in People Analytics, I recommend starting with my affordable course:
Practical People Analytics: Build data-driven HR programs to 10x your professional effectiveness, business impact, and career. This comprehensive course will teach you everything from building an HR dashboard for business results to driving growth through more advanced analytics (i.e., regression). Join your peers today! Also, don’t forget your 40% off: BF40BLAST

#2 If you are looking for support in your Human Capital programs like Engagement, Retention, and Comp & Ben and want to take a more data-driven approach, contact me for some consulting services at Tskhay & Associates.