Hey good people,
Today, we will talk about turnover. Again.
Yes, again!
Why?
Well, it seems to be one topic that loves a lot of attention. Sometimes, turnover is too high, and we want to correct it. Other times, it is too low, and we need to take immediate action to ensure we are not complacent.
But most of all, we want to plan for productivity.
Hence, this metric is critical to a whole bunch of forecasts we make. Here are a few examples:
Attrition
Performance and Effectiveness
Financial Cost Allocation
Option Grant Planning
And many more!
Today, however, I break down a special kind of turnover, Annualized Turnover, into:
Why?
How?
And, When?
Le-go!
Why?
Why measure turnover in an annualized way?
Indeed, this is a great question. After all, why not just look at the leavers in my company over the year and divide them by the starting headcount (Ooops, I, did it again to turnover)?
You get the turnover rate right away.
Well, sure, this allows you to see where you have been and what happened over 1 year.
However, it doesn't tell you:
What happened more recently
What will happen as you move forward
What you need to do right now
This is the problem annualization tries to solve.
It allows you to:
get out of the thinking in the past mentality
look into the future projections
focus on the now and make changes
This brings us to the how.
How?
To annualize your turnover, you take a period, say a quarter and calculate the turnover the usual way. Then, you make the key assumption:
If all else stays the same, what turnover will I have by the end of the year?
Multiply your turnover by 4 to get an annualized rate.
Here is another way to think about it:
The calculation is simple, and I guess I know why people don’t like it. It makes a wild assumption that things will stay the same for a long time.
It removes any seasonality effects: what if you have bad turnover in the same quarter year over year?
Fear not. There are ways of looking at this metric over time!
When?
You might not believe it, but time is your friend. Regardless of how you slice it, looking at a metric on one occasion leaves dimensionality behind and makes it static and boring.
So, look at how the metric changes over time whenever you can.
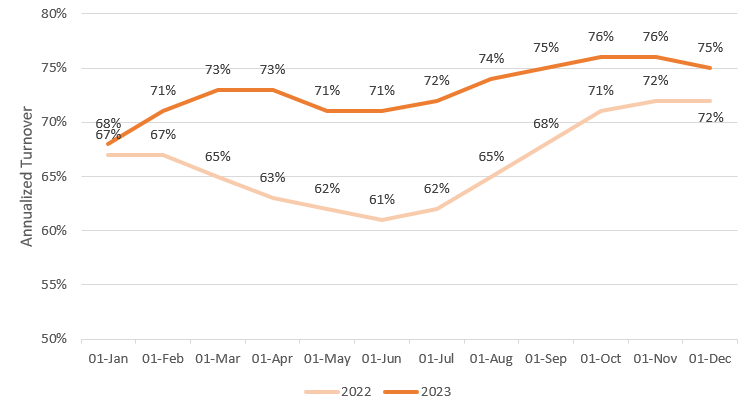
Here is an example of how I might look at an annualized turnover:
Now that allows me to see how my annualized turnover changes over time. It also highlights a seasonal effect in May, June, and July, showing a marked improvement over time in my convenient and fake data here.
But what is most helpful about this metric is that you can act on it.
When you see it dipping, you ask why and what you can do.
In contrast, a basic turnover metric makes you make explanations in hindsight and make decisions on things that may not be relevant anymore.
So, yes, it is a good metric, and I love using it.
Do it.
Btw, I have made this free course on turnover! Check it out here.
Cheers,
K
Learn People Analytics in a Practical Way!
👉 Check out my new Practical People Analytics Course that covers the most common questions I get from HR professionals:
What metrics should I use?
How do I measure engagement?
How do I make sure there is no bias in my comp?
What is the best way to measure performance?
How can I use advanced analytics to drive action?
Which means… you will have everything you need to build your data-driven HR function.


