
Turnover Benchmarks!
Whatever I could find anyways!

Reading time: 4 min
—
Hi friends!
Today, I will talk about turnover again. But this time around…
I brought you some benchmarks and numbers! Woo hoo!

But before I share them, I am so happy people love my course! 🥲🥹

These two testimonials are warming my cold heart! ^^
Now that I got this out of the system…
Over to turnover rates!
Over the last 6 months, I’ve noticed “Does anyone have turnover benchmarks?” to be one of the most common questions in the HR communities I am a part of.
It also was one of the questions I could not answer.

I did not have the rates. I just didn’t.
And it drove me crazy!
So, I decided to go out there and gather some information to share with you!
I have some rates now!
Let’s start with caveats first, however.
Going through what’s out there, I found benchmarks from many different sources, including the Bureau of Labour Statistics, LinkedIn, The Conference Board of Canada, Monster, and Payscale. Just yesterday, Pwc also released their numbers!
Pretty serious organizations, eh?

All these organizations went into their databases and ran surveys to get us the most up-to-date and reputable rates for 2021 and 2022.
Yet, the rates were all over the place!

Reasons?
Measurement was not consistent. Different ways of calculating turnover—some reported total, some reported voluntary turnover, and some used the wrong denominator (more on this below).
Samples were different. Some used data from their customers, others collected it via surveys, and others used payroll data.
But here we are.
Without having actual data, we, as consumers, cannot verify what is provided. But we can still examine what was provided and make some conclusions. I took all the data provided by the industry and averaged them!
Here are the average rates by industry!
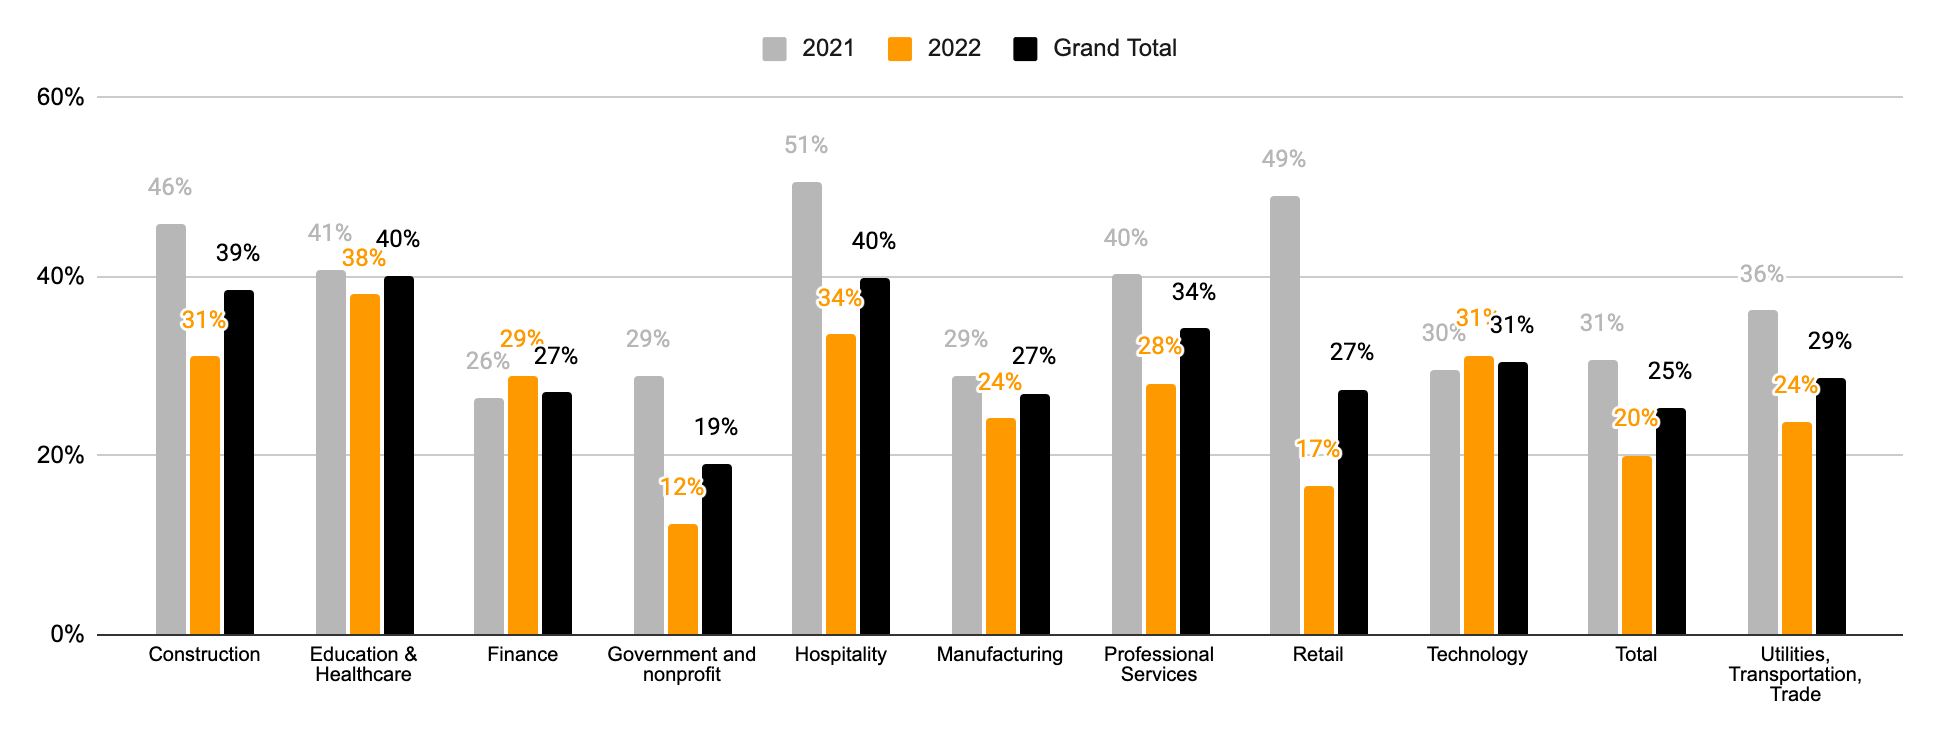
As you can see, overall, we are looking at about 20% turnover for 2022, with the overall trend of lower turnover in 2022 than in 2021, likely due to the changes in the macro-economic environment and moving from the Great Resignation to Hold on For Dear Life.
You can also see the effects of the pandemic in the graphs: industries with greater exposure to customers—education, healthcare, construction, and hospitality, experienced higher turnover than other industries, especially in 2021.
Tech and Professional services continued to show high turnover across the board, with usual suspects showing low turnover (ahem, government).
The only surprise to me was retail in the current sample. I certainly would expect the rates for retail to be higher.

Of course, given the data are not the best, we have to exercise our judgment when interpreting these results.
Looking at the data here and connecting to my inner gut, these numbers are not shocking and likely are even directionally correct, something we say whenever our confidence is below 95%.
Of course, that’s how you should view any benchmark anyways.
FINALLY! Some people calculate turnover by averaging the starting and ending headcount! 😤
Why are you doing that?

Turnover is the rate at which people leave the organization in a period. In other words, of all the people you had initially, how many left over, say 6 months? What does that mean in percentage terms?
To get this number, you don’t need to average the starting and ending headcount. Doing so is total nonsense and meaningless!
STOP it and use the simple formula below:
Turnover = [ Leavers / Starting Headcount in the period ] * 100%
K
Learn People Analytics in a Practical Way!

Check out my new Practical People Analytics Course that covers the most common questions I get from HR professionals:
What metrics should I use?
How do I measure engagement?
How do I make sure there is no bias in my comp?
What is the best way to measure performance?
How can I use advanced analytics to drive action?
Which means… you will have everything you need to build your data-driven HR function.
Thanks for this great article! This is indeed an important subject these days and as you pointed out, there is no good reliable source of these benchmarks. But I’m curious about your closing statement about ‘Turnover Calculation’.
As far as I’ve seen companies use either the average or ending headcount or starting headcount for numerators as they like/according to their availability of data.
Why would you say that starting headcount is the preferred way? Is there any literature or articles recommending on over the other that I should read?